

3 February '25
Monday 3 February 09:00 - 16:30, including lunch! But beware, only 15 lucky participants will get the chance to join this visual revolution!
Monday 3 February 09:00 - 16:30, including lunch! But beware, only 15 lucky participants will get the chance to join this visual revolution!


€499,- p.p.
What makes this day even more special? For just €499 excluding VAT per person, you can join this unique experience, including a delicious lunch to keep your energy levels up while you learn and grow!
What makes this day even more special? For just €499 excluding VAT per person, you can join this unique experience, including a delicious lunch to keep your energy levels up while you learn and grow!

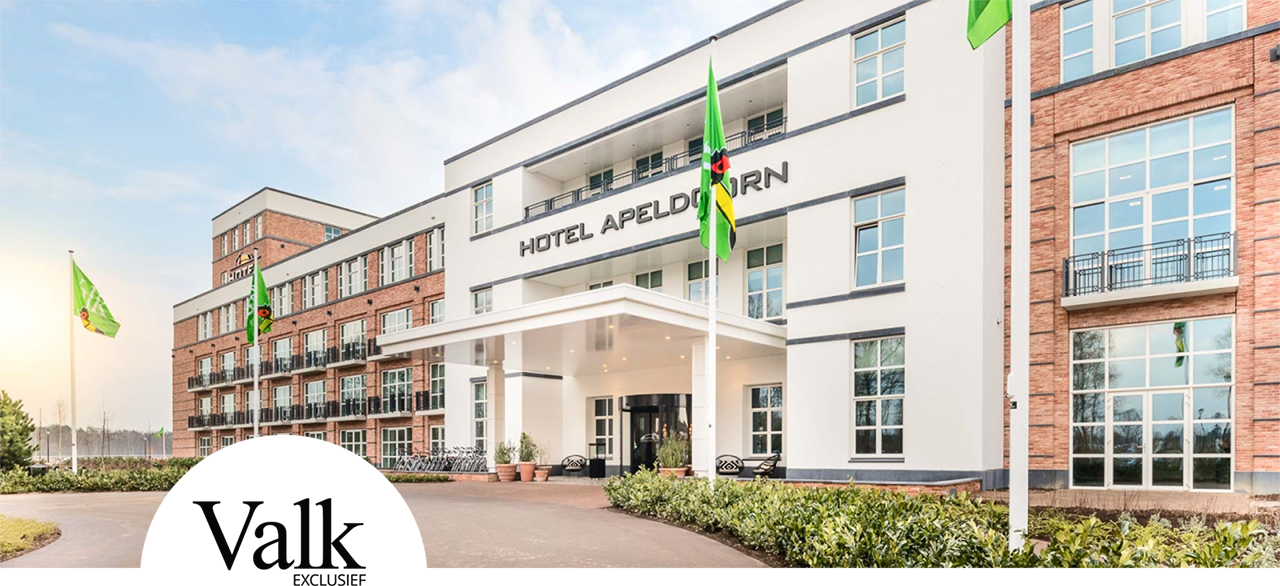
Hotel Apeldoorn
Hotel Apeldoorn is ideally located at Landgoedlaan 26, near the A1 and A50 highways. This central location ensures easy accessibility and serves as the perfect base for DEXS.
Hotel Apeldoorn is ideally located at Landgoedlaan 26, near the A1 and A50 highways. This central location ensures easy accessibility and serves as the perfect base for DEXS.


It was an incredibly valuable day
Review Masterclass Power BI design
"Thank you, Armand, for sharing your secrets and for the inspiration and knowledge you brought to the session! It was an incredibly valuable day that went by way too quickly.
Your passion for data and design is truly contagious, and it was inspiring to learn from such a diverse group of professionals! Your ability to break down complex concepts into simple, actionable steps was impressive and extremely helpful. The practical examples and real-life applications you shared will definitely help us elevate our future dashboards!"
Stef Bosgoed, owner Intigo
From good to great!
LIVE Dashboard Makeover in Power BI
You’ll receive feedback on your own dashboards from Armand van Amersfoort, MVP and expert in visual data presentation. Are you ready to take your Power BI dashboards to an entirely new level of visual excellence? Do you feel your reports could use an aesthetic boost? Then I have the perfect workshop for you!
From Beginner to Expert: Everyone is Welcome
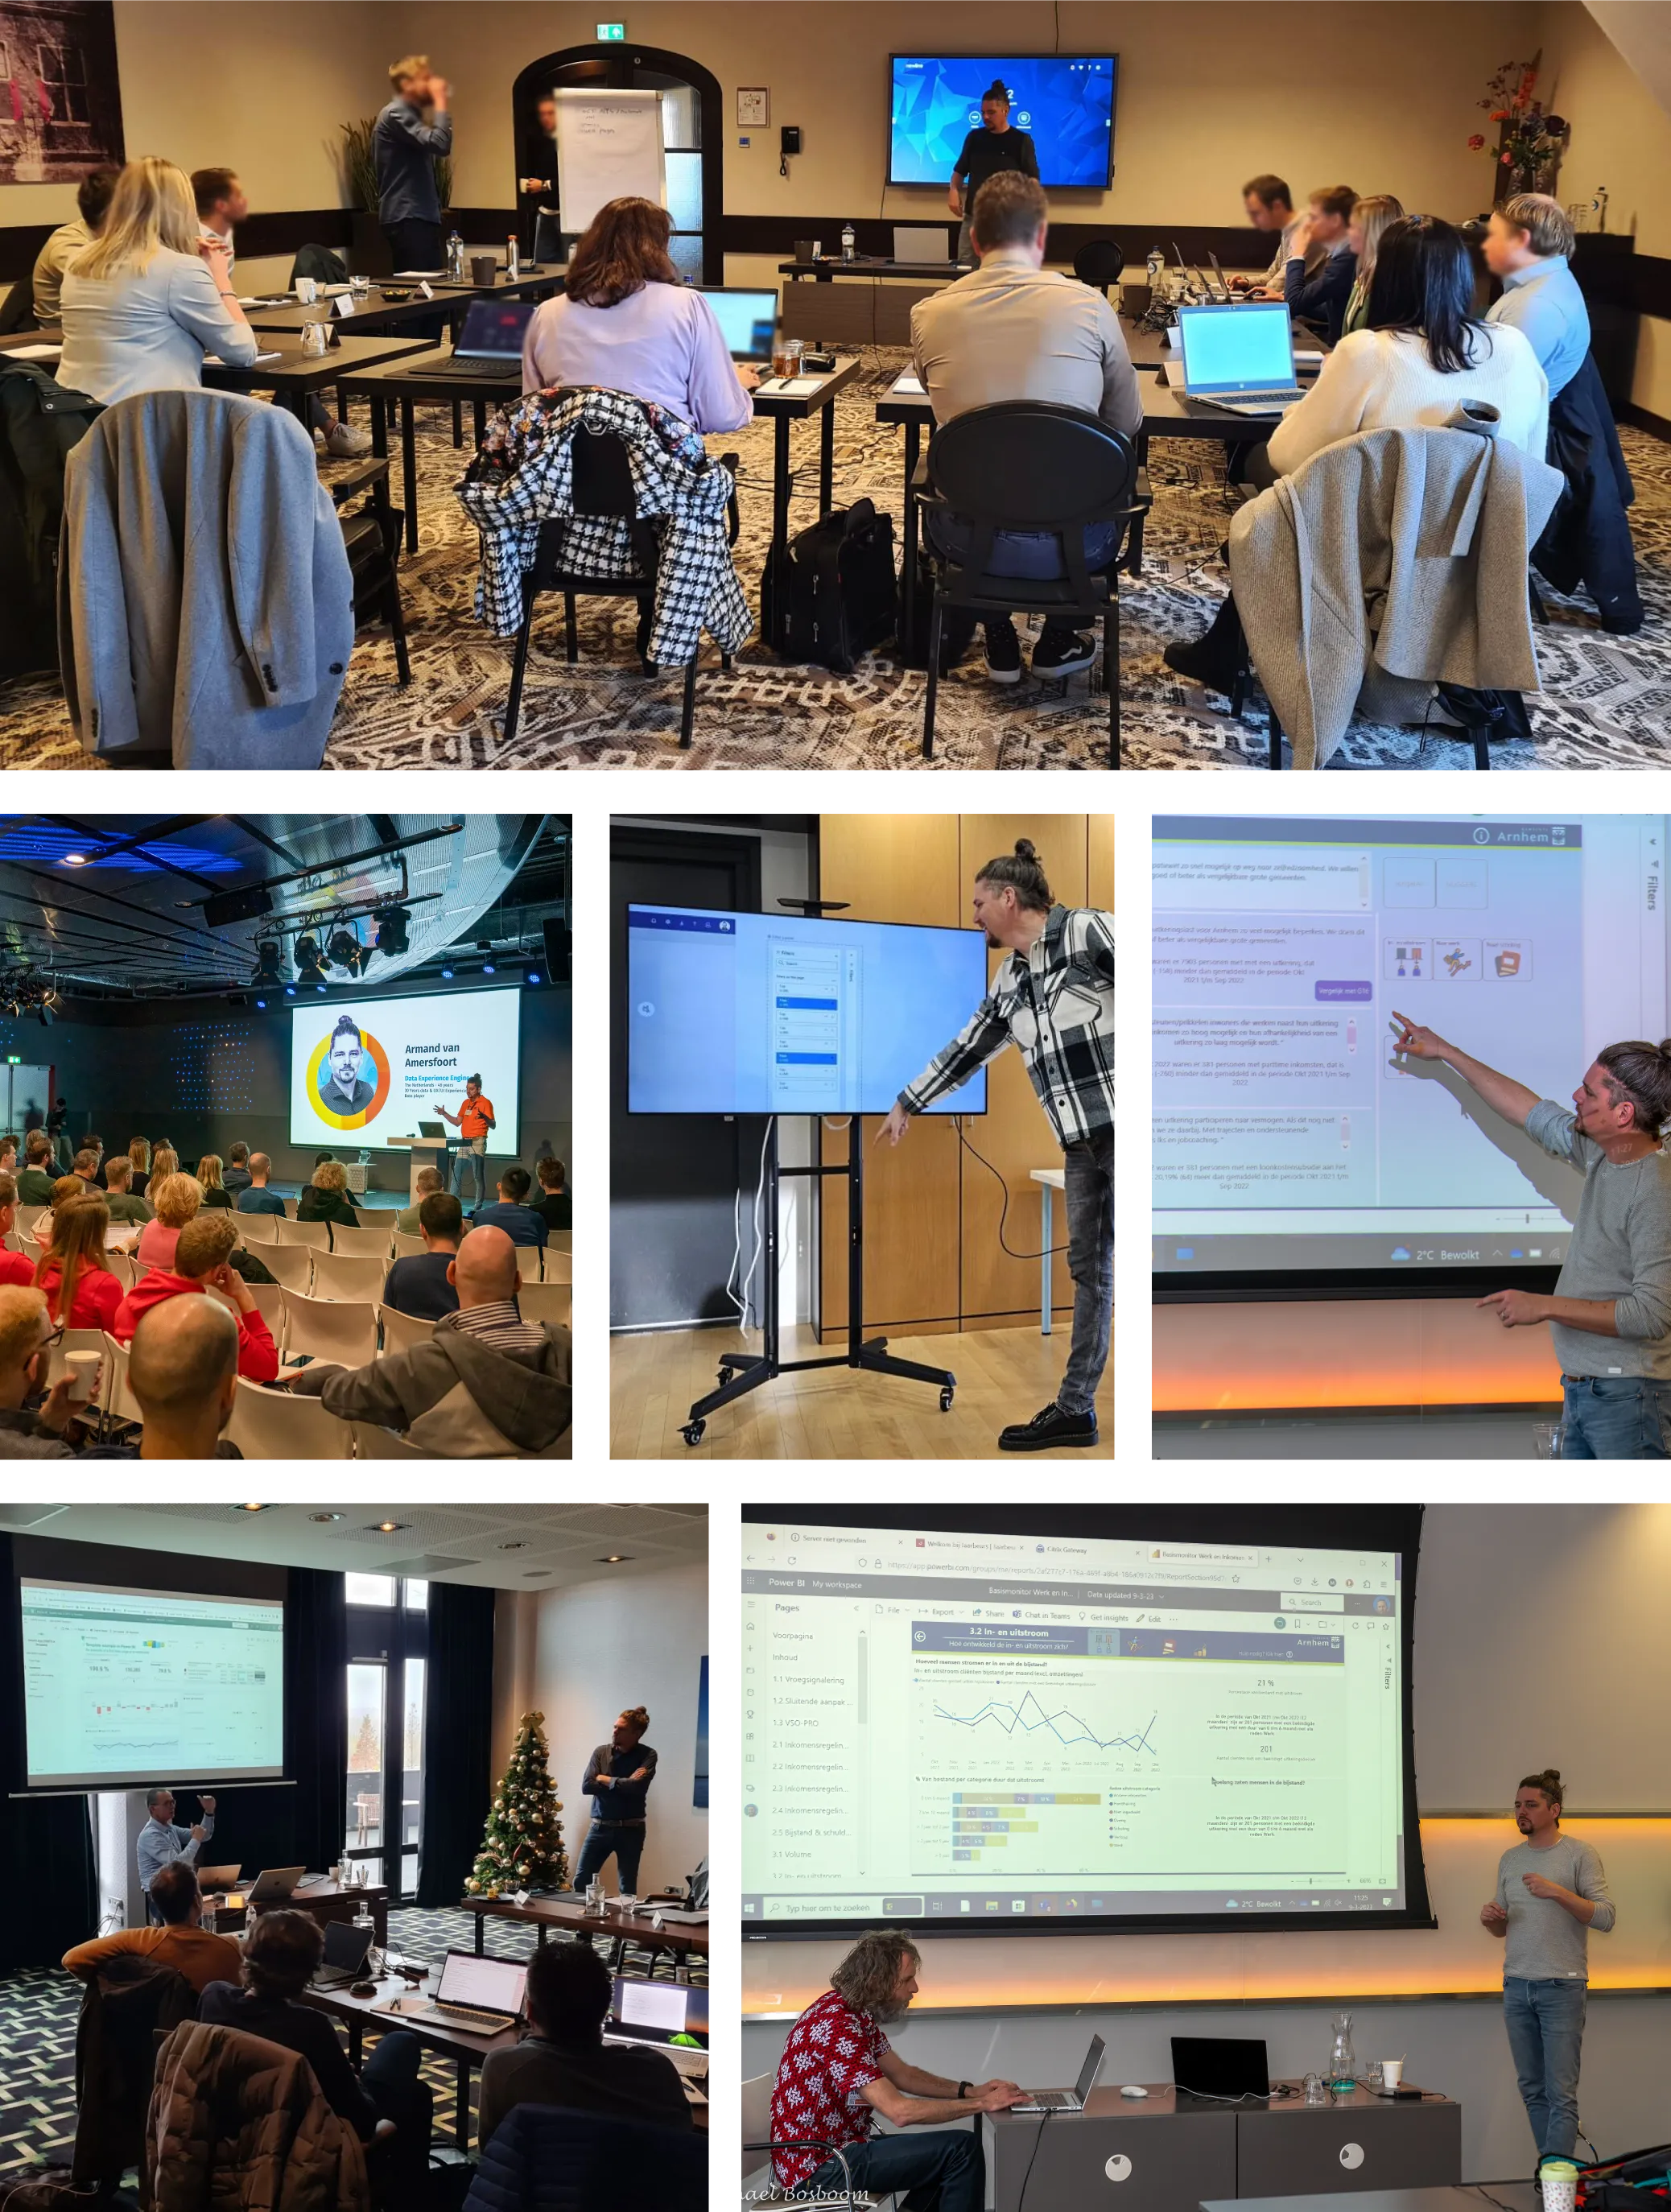
During my Power BI Design Masterclasses, I have had the privilege of welcoming professionals from a variety of leading companies. The logos below represent some of the organizations that have participated in these sessions. Their presence is a testament to the trust in the quality and impact of the training I offer.
Live feedback on your own reports
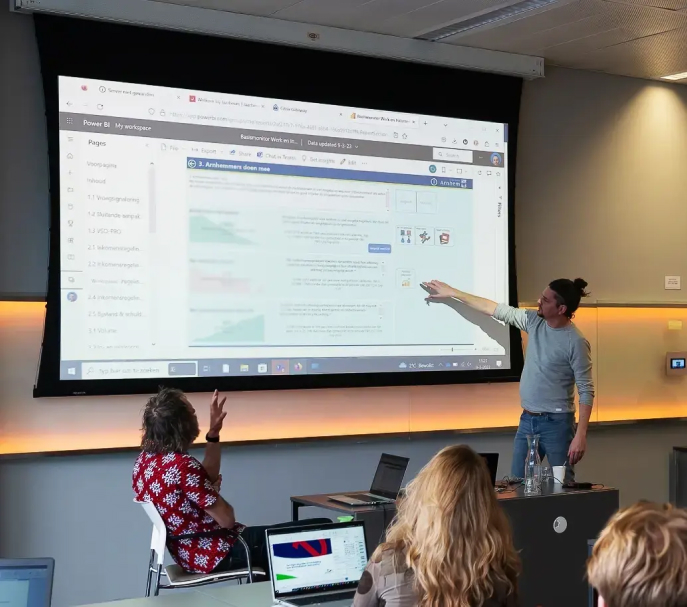
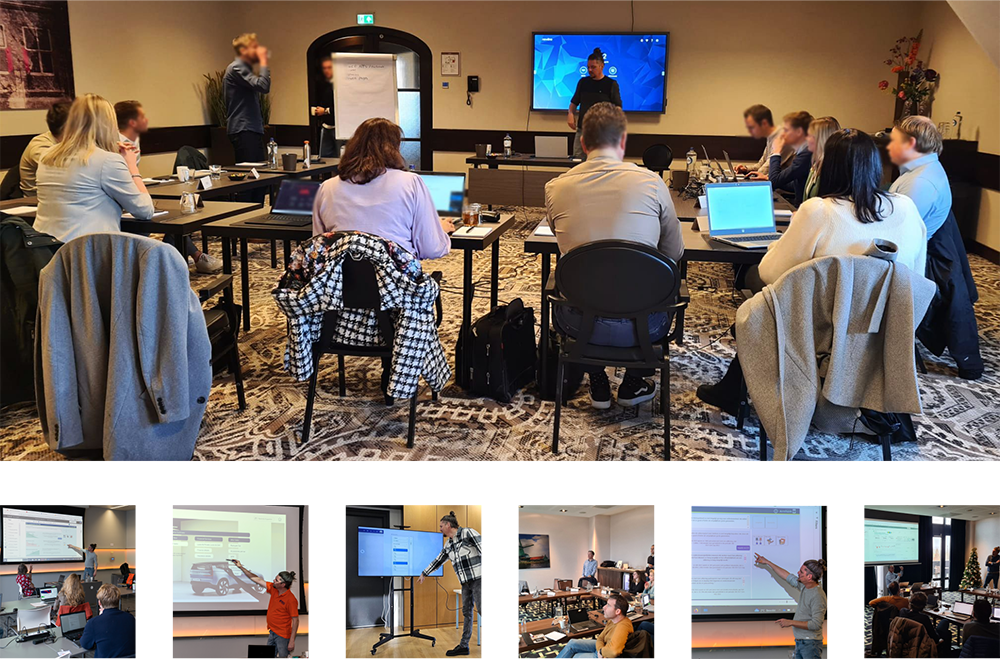
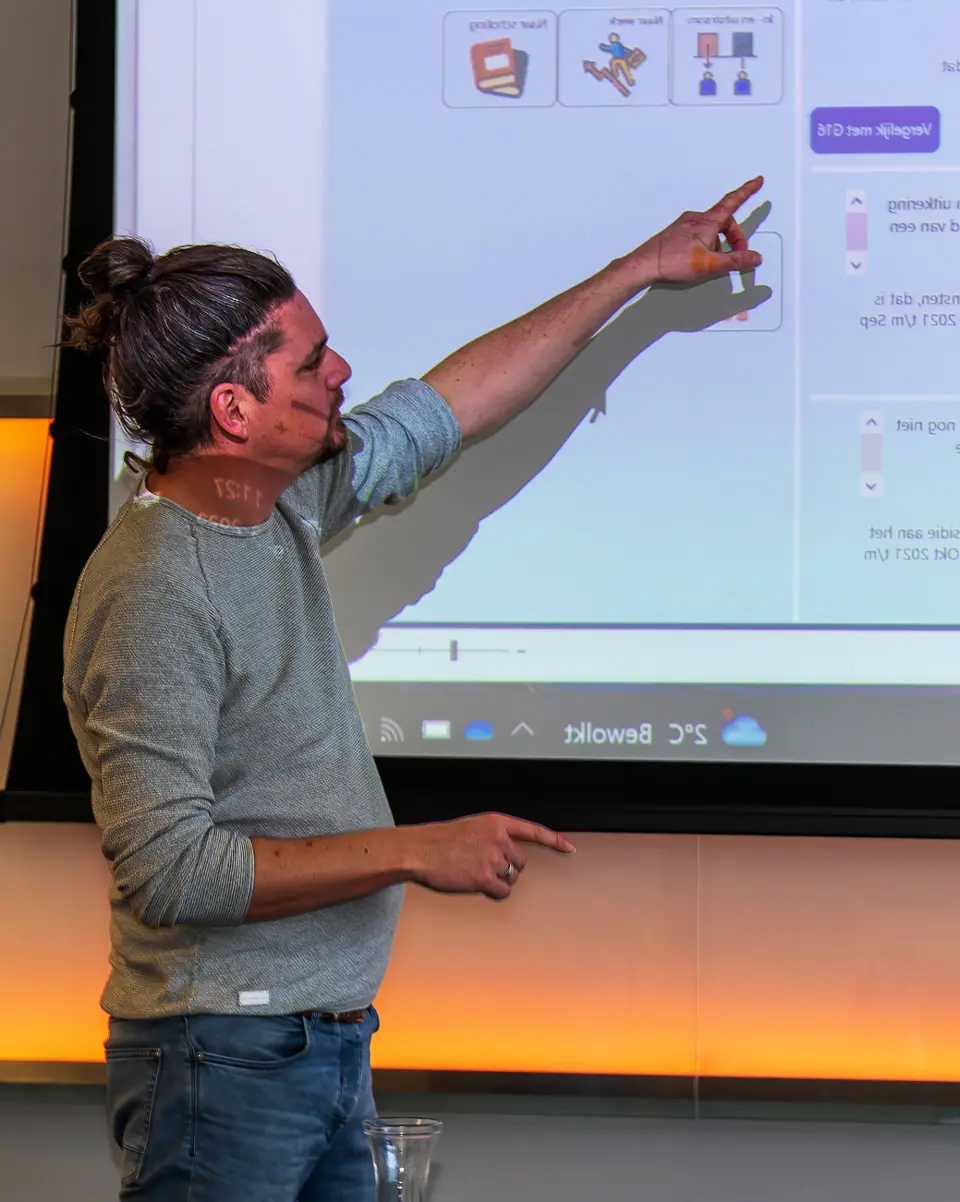
During the training, interaction with participants is encouraged, with a special focus on live feedback on their own reports. This aspect of the training provides a unique opportunity for participants to receive direct guidance and advice from me as an expert, while applying their skills in practice. The live feedback sessions also offer a chance for participants to ask questions, discuss challenges, and collaboratively find solutions, helping them feel supported in their learning process and building confidence in their Power BI skills.
What to Expect?
A unique opportunity to receive live tips and tricks from expert visual designer Armand van Amersfoort to visually enhance your Power BI dashboards. We’ll dive deep into the world of Power BI design and data visualization, sharing practical techniques to bring your data to life.
But that’s not all. This session goes beyond just listening to an expert. We also want you to share your visual challenges and successes, so we can learn and grow together.
But that’s not all. This session goes beyond just listening to an expert. We also want you to share your visual challenges and successes, so we can learn and grow together.
But You’re Not Alone!
Imagine this: you’re in a room with like-minded individuals, all driven to make a bigger impact with their data. You’ll have the chance to discuss your most complex visualization challenges, learn new techniques, and gain inspiration from others.
So, are you ready to be part of this exclusive visual revolution? Make sure to reserve your spot, because they’ll go fast! Send me a message to express your interest, and who knows, I might see you soon at Hotel Van Der Valk for a day full of inspiration and visual data skills!
So, are you ready to be part of this exclusive visual revolution? Make sure to reserve your spot, because they’ll go fast! Send me a message to express your interest, and who knows, I might see you soon at Hotel Van Der Valk for a day full of inspiration and visual data skills!
What Makes This Training So Special?
What makes this training so special? Beyond the fact that you’ll be learning directly from an expert, this day offers an intimate setting where you can benefit from personalized guidance and direct feedback. Forget standard courses – this training is designed to address your specific needs and elevate your visual data skills to the next level.
Imagine: an entire day dedicated to exploring and developing your data design skills, surrounded by like-minded individuals who are just as passionate about data and design as you are. It’s an opportunity not only to learn but also to grow, inspire, and be inspired by others in the field.
During the training, interaction with participants is encouraged, with a special focus on live feedback on their own reports. This aspect of the training provides a unique opportunity for participants to receive direct guidance and advice from me as an expert while applying their skills in practice.
The live feedback sessions also offer participants a chance to ask questions, discuss challenges, and collaboratively find solutions, helping them feel supported in their learning process and building confidence in their Power BI skills.
English
The training will be conducted in English. Are you ready to take your Power BI dashboards to an entirely new level of visual excellence? Then this workshop is perfect for you!
The training will be conducted in English. Are you ready to take your Power BI dashboards to an entirely new level of visual excellence? Then this workshop is perfect for you!

Live review
This aspect of the training provides a unique opportunity for participants to receive direct guidance and advice from me while applying their skills in practice.
This aspect of the training provides a unique opportunity for participants to receive direct guidance and advice from me while applying their skills in practice.

Max 15 participants
There is space for a maximum of 15 participants, so be quick! Last year, the workshop sold out quickly, so don't wait too long to sign up.
There is space for a maximum of 15 participants, so be quick! Last year, the workshop sold out quickly, so don't wait too long to sign up.
What Topics Will Be Covered?
When designing Power BI training, it’s essential to cover a wide range of topics to give participants a thorough understanding of the platform. We start by discussing the structure of the canvas, covering the basics of the Power BI canvas, including the organization of visualizations and the use of pages and filters.
Next, we delve into best practices for report design, focusing on layout, color, formatting, and adding interactivity to reports. We will then explore various data visualization techniques and choices, including different types of visualizations and advanced visualization options. We will also discuss the influence of design on data visualization, including the psychology of data visualization, user-centered design, and accessibility and inclusivity.
Another important aspect we will cover is storytelling with data, where we’ll discuss the importance of creating a narrative around data insights and how textual elements can be used to add context. Finally, we will look at future possibilities, such as new features in development, emerging trends in data visualization, and the evolving role of Power BI as a platform for business intelligence and decision-making.
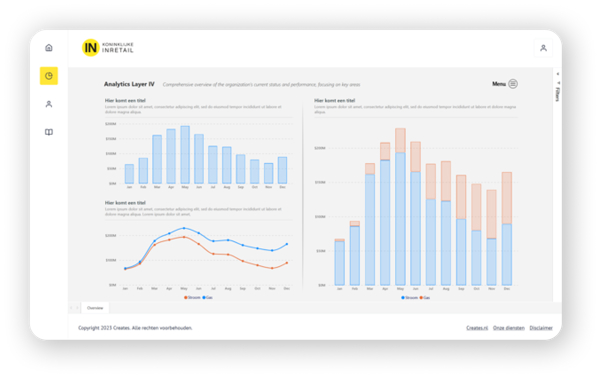
Canvas en interface design
Het canvas design in Power BI vormt de basis voor het creëren van overtuigende en effectieve datavisualisaties. Met een intuïtieve interface kunnen gebruikers snel en gemakkelijk visualisaties toevoegen, organiseren en aanpassen om inzichten te onthullen en verhalen te vertellen. Datavisualisatie
Het canvas design in Power BI vormt de basis voor het creëren van overtuigende en effectieve datavisualisaties. Met een intuïtieve interface kunnen gebruikers snel en gemakkelijk visualisaties toevoegen, organiseren en aanpassen om inzichten te onthullen en verhalen te vertellen. Datavisualisatie
Data Visualization and Insights
Data visualization design is an art that focuses on effectively communicating complex data in a clear and compelling way. It goes beyond merely creating charts and graphs; it involves understanding the message you want to convey and selecting the right visual elements.
Data visualization design is an art that focuses on effectively communicating complex data in a clear and compelling way. It goes beyond merely creating charts and graphs; it involves understanding the message you want to convey and selecting the right visual elements.
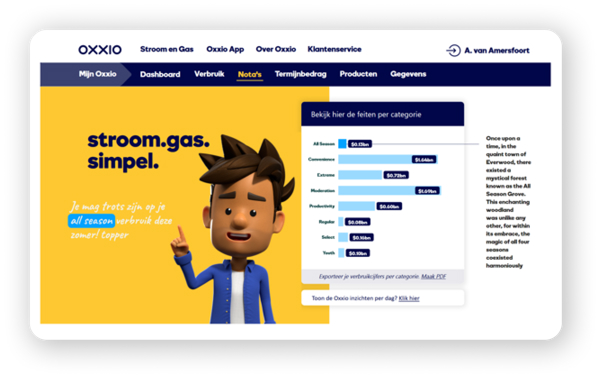
Storytelling and Customer Journey
Storytelling in data visualization is the ability to tell a story with data, bringing abstract numbers to life and giving them meaning. It goes beyond simply presenting facts; it’s about having the data tell a story that resonates with the viewer and motivates them to take action.
Storytelling in data visualization is the ability to tell a story with data, bringing abstract numbers to life and giving them meaning. It goes beyond simply presenting facts; it’s about having the data tell a story that resonates with the viewer and motivates them to take action.
From Beginner to Expert: Everyone is Welcome
During my Power BI Design Masterclasses, I have had the privilege of welcoming professionals from a variety of leading companies. The logos below represent some of the organizations that have participated in these sessions. Their presence is a testament to the trust in the quality and impact of the training I offer.

A Very Inspiring Course Focused on the UI/UX of Power BI
"About four months ago, Thandi and I took the course below, given by Armand van Amersfoort, focused on the UI/UX of your Power BI dashboards. And it was amazing! Honestly, I would go again, but then you can't join anymore ;)!!
Over the past four months, Thandi and I have given many of our (client) dashboards a significant upgrade. Our dashboards are now much more stylish, user-friendly, and easier to read. Not quite at the level of the one above, but definitely fresher!
Recent feedback includes: "Woww!! That looks really cool! Thanks!!!" and "Having a corporate style makes searching and viewing all dashboards much more enjoyable."
Niels Kamerling, owner Bottleneck-it
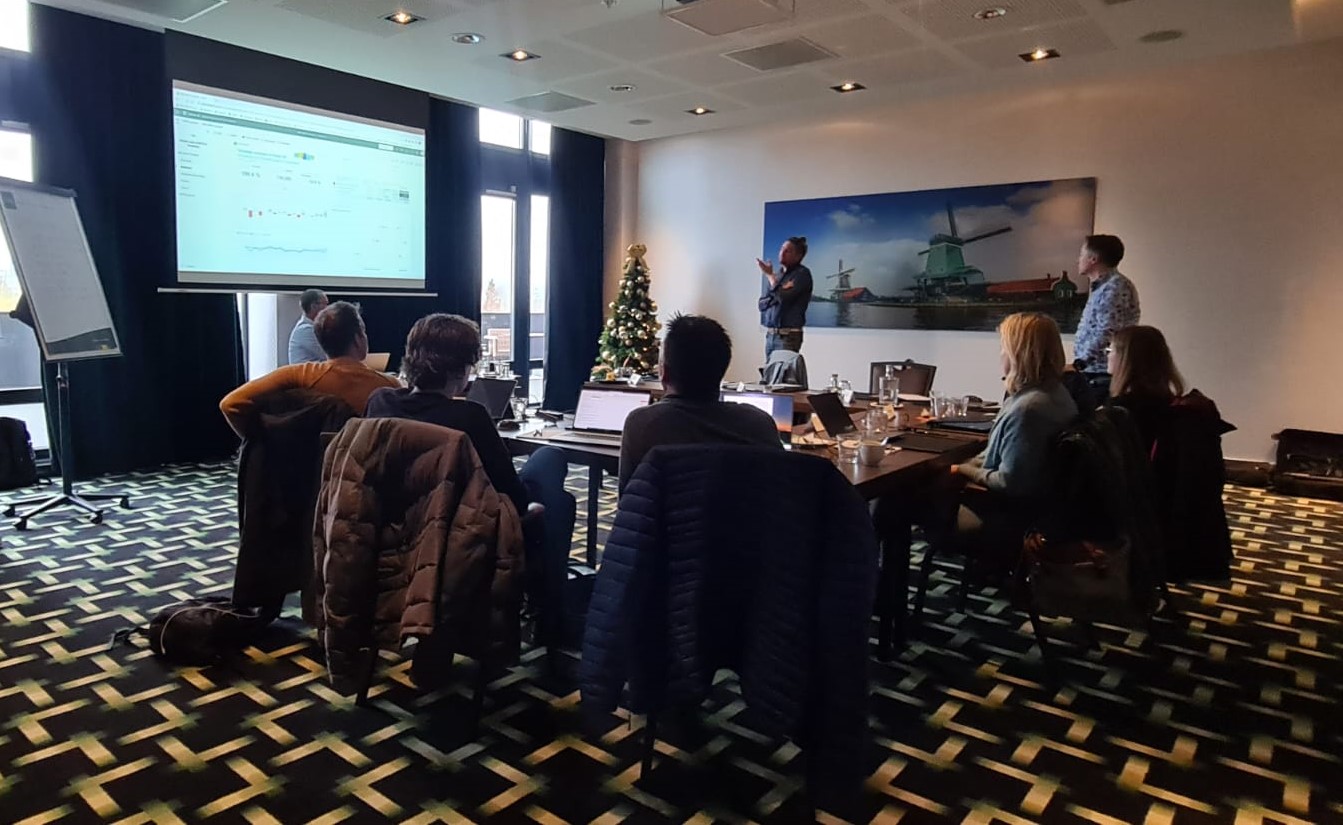
Power BI design training at Van der Valk Apeldoorn
During my training at Van der Valk Apeldoorn, you’ll experience a comfortable and welcoming environment. In the business lounge, you’ll have unlimited coffee, tea, and soft drinks, so you can always enjoy a refreshing break. Bottled mineral water and mints will be available in the room to keep you energized throughout the day. Between sessions, you can treat yourself to sweet treats and healthy, refreshing snacks available in the lounge.
For lunch, we offer a luxurious buffet in the restaurant, where you can enjoy a variety of delicious dishes, or a working lunch in or near the meeting room, allowing you to make the most of the day. It’s the perfect setting to not only learn but also feel comfortable and well-cared for.
For lunch, we offer a luxurious buffet in the restaurant, where you can enjoy a variety of delicious dishes, or a working lunch in or near the meeting room, allowing you to make the most of the day. It’s the perfect setting to not only learn but also feel comfortable and well-cared for.